
Stars
A star is a hot cloud of gas held together by its own gravitational pull. The Sun is the nearest example of a star to Earth, and like the Sun, most stars produce light because of the high temperature of the gases they contain. Like living things, stars are born, live, and die, though their lifespans are much longer than ours -- millions, billions, or even trillions of years.
We know these things because we can explain and predict the observed properties of stars using computer simulations based on known physics. Stars form through the collapse of cold, dense hydrogen gas clouds in the interstellar medium. When their centers become hot and dense enough, nuclear fusion reactionsA type of reaction in which atomic nuclei fuse together to make heavier nuclei. Through the equivalence of mass and energy predicted by Einstein's theory of special relativity, the combined nuclei lose some mass, which is released as energy. start to produce energy that keeps the gas from collapsing further.
A star spends most of its life in a state of balance between gravity and pressure (hydrostatic equilibriumA condition in which a fluid is kept at rest by a balance of forces, usually pressure and gravity.). During this main sequenceThe portion of a star's life during which it produces energy by fusing hydrogen into helium at its center. phase, nuclear reactions gradually convert hydrogen to helium in the star's core. The more massive a star is, the higher the pressure in the core is and the faster the nuclear reactions happen. This means that the more massive a star is, the faster it will evolve. Once enough hydrogen is used up, nuclear reactions stop at the very center of the star. However, they continue in a shell around the center, growing the helium-rich core and puffing the star up into an enormous red giantA late stage of stellar evolution in which a star fuses hydrogen into helium in a shell surrounding a core made of helium. A red giant is swollen well beyond the star's main-sequence size and has a reddish color because of its low surface temperature (around 3000 degrees)..
Eventually, enough helium builds up in the core. Stars that are too low mass (less than 0.5 solar masses) to burn helium in the core end stellar evolution by shedding their outer layers, leaving behind a planetary nebulaA brilliantly colored cloud of gas ejected from a low-mass star during its final years as a giant. The gas is lit up by ultraviolet radiation produced by the white dwarf that is left behind when the last of the gas outside the core is lost. Has nothing to do with planets, despite the name. and a helium white dwarfA stellar corpse; the extremely dense core of a low-mass star. White dwarfs are typically about the size of the Earth but the mass of the Sun. They are kept from collapsing under their own weight by a quantum mechanical phenomenon called electron degeneracy pressure. Helium white dwarfs are made mostly entirely of helium, hence the name. (He WD). Because of their incredibly long long main sequence lifetimes, none of these exist in isolation but are known to exist due to binary interactions.
The cores of more massive stars (between 0.5 and 8 solar masses) are able to burn helium into carbon and oxygen but cannot fuse carbon or oxygen further. The outer layers of these stars are blown off into space as planetary nebulae, leaving behind carbon-oxygen white dwarfs Another kind of white dwarf made mostly of carbon and oxygen.(CO WDs).
Stars more massive than about eight times the Sun's mass have a very different fate. Their cores are able to get hot enough after repeated fusion cycles to fuse carbon and oxygen, neon, magnesium, silicon, all the way up to iron. Since iron is the most stable type of atomic nucleus, fusing it cannot release energy to keep the star hot, and the core collapses a final time, releasing a huge burst of energy that destroys the outer parts of the star in a supernova explosionThe explosive destruction of a star, either through release of gravitational energy (a "core collapse supernova") or unstable nuclear reactions (a "thermonuclear supernova").. What is left of the core becomes a neutron starA stellar corpse; the extremely dense core of a high-mass star, left behind after a core-collapse supernova. Neutron stars have roughly the mass of the Sun but are the size of a city. Because of their extremely high density, their constituent atomic nuclei have broken down to form a single giant "nucleus". or black holeA region of space in which matter has been compressed so much that light itself cannot escape the gravitational field. Stellar-mass black holes are left behind by supernova explosions in which enough material fell into the star's core that it could not remain stable as a neutron star..
Astrophysical events often involve data spanning a large range. When that’s the case, logarithmic (log) scales make plotting those data and interpreting the graphs much easier. Indeed, many of the plots on iADD and in other astrophysics literature are plotted with semi-log scalesWhen one axis is on a log scale and the other is on a linear scale. or log-log scalesWhen both axes are on log scales..
On a log scale, equal spacing on the axis corresponds to a base value raised to powers. This base value is usually 10. For example, if the first tick on a log scale is 100 = 1, the second tick is 101 = 10, the third tick is 102 = 100, and so on. Numbers that are equally separated, say 1, 2, 3, and 4, are not equally spaced on a log scale. The space on the axis between 1 and 2 is much larger than between 9 and 10, even though the difference between both pairs is 1.
Stellar Evolution Simulator
Our stellar evolution simulation solves the equations that govern the internal structure of stars, allowing us to predict the behavior of different kinds of stars over the course of their lives. The results are plotted on the Hertzsprung-Russell diagramA diagram showing stars as individual points on a plot with temperature or color on the horizontal axis and luminosity or brightness on the vertical axis. Usually the axes are logarithmic, so that a given distance along an axis corresponds to multiplication rather than addition, and the horizontal axis is backwards, so hotter stars appear to the left., which plots the luminosity (brightness) against the surface temperature. Individual stars trace out curves on this diagram as they evolve. Check out some of our precomputed stellar evolution simulations below.
| Name of Video | Description |
|---|---|
| The Sun | This simulation shows where the Sun lies and moves on the HR diagram as it evolves over time. |
| Intermediate Mass Stars | This simulation shows the evolution of 12 intermediate mass stars, ranging in mass from 0.9 to 2 solar masses. |
| One to Eight Solar Masses | This simulation shows the evolution of 8 stars, ranging in mass from 1 to 8 solar masses. |
| Stars Become White Dwarfs | This simulation shows the evolution of 7 stars that will eventually become white dwarf stars. Their masses range from 5 to 8 solar masses. |
| Stars Become Neutron Stars | This simulation shows the evolution of stars that will eventually become neutron stars. |
| High Mass Stars | This simulation shows the evolution of 7 high mass stars ranging from 20 to 80 solar masses. |
| Intermediate Mass vs. High Mass | This simulation shows the difference in the evolution stages and evolution times of an intermediate mass star of 3 solar masses versus a high mass star of 15 solar masses. Note that the evolution tracks are on in this simulation. |
| Intermediate Mass Star | This simulation shows the evolution of one 2 solar mass star, with attention focused on the star's main sequence, subgiant branch, giant branch, horizontal branch, and asymptotic giant branch. The star's death is also shown in this simulation, as it dies in a planetary nebula, leaving a dense white dwarf behind. Note that the evolution tracks are on in this simulation. |
| High Mass Star Life | This simulation shows the evolution of 3 stars, of masses 10, 15, and 20 solar masses. The simulation focuses attention on the main sequence, subgiant, and the various red giant/supergiant stages of high mass star evolution. Note that the evolution tracks are on in this simulation. |
| High Mass Star Death - Supernova | This simulation shows the evolution of one 15 solar mass star. The main focus of this particular simulation is that high mass stars such as this one die in a violent explosion known as a type II supernova. Note that the evolution tracks are on in this simulation. |
| 999 Stars | This simulation shows the evolution of 999 stars, with their masses determined by an initial mass function. Note that the evolution tracks are not on in this simulation. |
Binary Stellar Evolution Simulator
Our sun is quite unusual in that it lives alone. Most stars are born with at least one companion and star systems with just two stars are called binary star systemsA system in which two stars orbit each other because of their mutual gravitational pull. . When stars exist in binaries, they can influence each other’s evolution. If the two stars are close enough and/or produce stellar windsAn outflow of matter that escapes from the surface of a star due to the pressure from the light the star produces., dramatic changes in evolution can be seen.
Any two massive orbiting bodies M1 and M2 will have Lagrange pointsPoints in space where the forces from two massive objects on a smaller object are balanced.. There are five Lagrange points, labeled L1, L2, and so on. For binary stellar evolution purposes, L1L1 lies on the line between M1 and M2 and where the gravitational attraction from either is equal. It is an unstable equilibrium, so small movements will knock an object out of L1. is the most important to understand. You can see where the other Lagrange points lie in some of our animations.
One case of mass transfer When one star ‘donates’ or loses mass and the other star gains some or all of that mass. requires understanding of the L1 point. As stars in binary star systems evolve, a star M1 expands and the matter from it may 'fall' through the system's L1 point to star M2. At this stage, it is said that star M1 is filling its Roche lobeThe region around one star in a binary in which matter is gravitationally bound to that star. and undergoing Roche lobe overflowWhen a star in a binary fills its Roche lobe, matter can be transferred to the other star through the L1 point. (RLOF).
Mass transfer comes in two cases: conservative and non-conservative. Conservative mass transfer simply means that both mass and angular momentumThe rotational analog of regular momentum. Simply put, angular momentum is an object's tendency to keep rotating. Rotational angular momentum refers to an object rotating around its own axis, like a spinning top. Orbital angular momentum refers to an object orbiting something else, like a moon. are not lost. In non-conservative mass transfer, mass and/or angular momentum are lost. Most commonly, mass is carried away by stellar winds. That lost mass also carries with it angular momentum. Several phenomena can carry away angular momentum independently, such as gravitational wave radiationRadiation produced by the movement of masses. One can reasonably compare them to electromagnetic waves (otherwise known as light). Much like light, gravitational waves radiate away energy. Over long periods of time, this lost energy brings objects in a binary orbit closer together. or magnetic brakingThe loss of angular momentum due a star's magnetic field. The magnetic field captures mass and ejects it from the star. This ejected mass also carries angular momentum..
The animations below are generated from simulations based on real binary systems we observe in the universe. If not otherwise noted, all simulations are run with MESA r24.08.1. Please check them out! If you have any systems you'd like to see added, please contact us. In all the animations, the color of the current point reflects the color of the stars.
| Name of System |
|---|
| Algol |
| Double WD AM Canum Venaticorum |
| Common Envelope Evolution |
| Cataclysmic Variable |
| Wolf-Rayet |
Paper credits:
TULIPS: Tool for Understanding the Lives, Interiors, and Physics of Stars - Laplace, E (2022)
Modules for Experiments in Stellar Astrophysics -
Paxton (2011), Paxton (2013), Paxton (2015), Paxton (2018), Paxton (2019), Jermyn (2023)
Image credits: "Afternoon sky from Rockgrove Road" - Jim Simonson (CC 2.0) "The Sun as a red giant" - Tablizer at English Language Wikipedia (CC 3.0); "M57: The Ring Nebula" - NASA, ESA, and the Hubble Heritage Team (STScI/AURA)
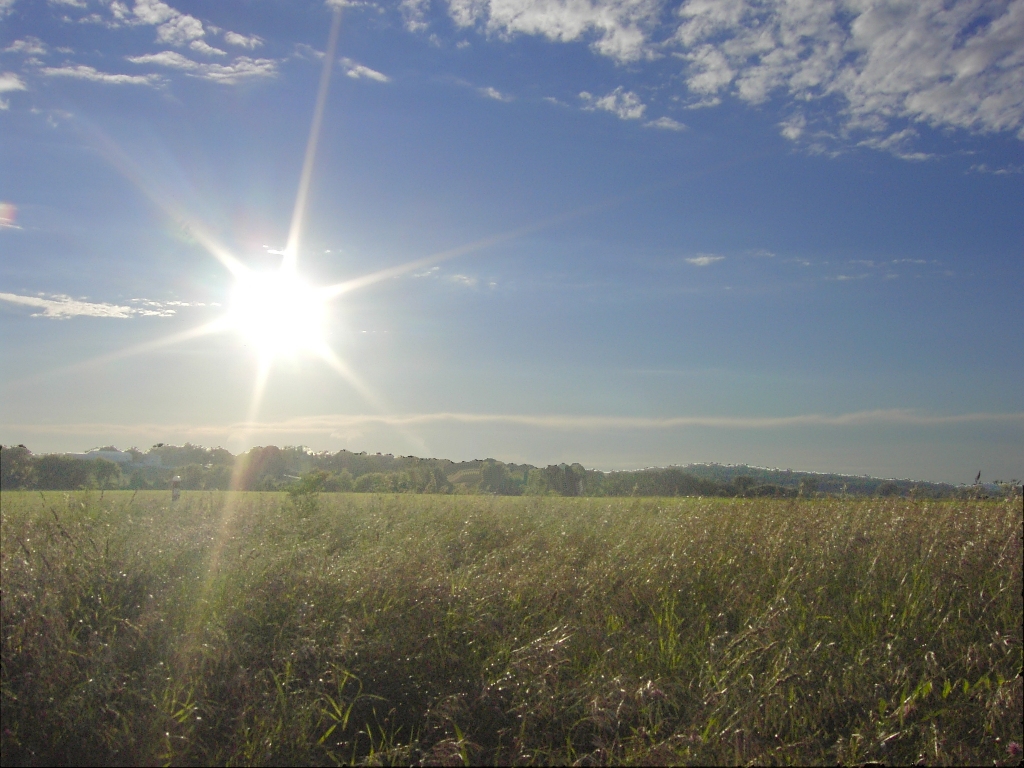
A typical star.
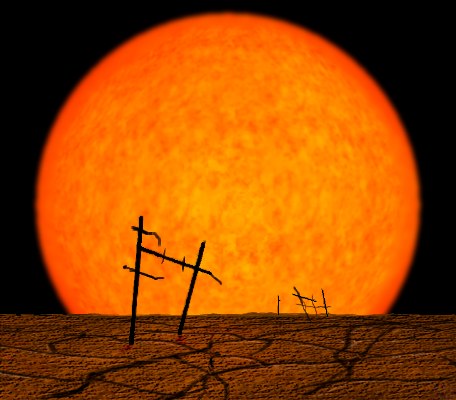
A red giant (artist's conception).
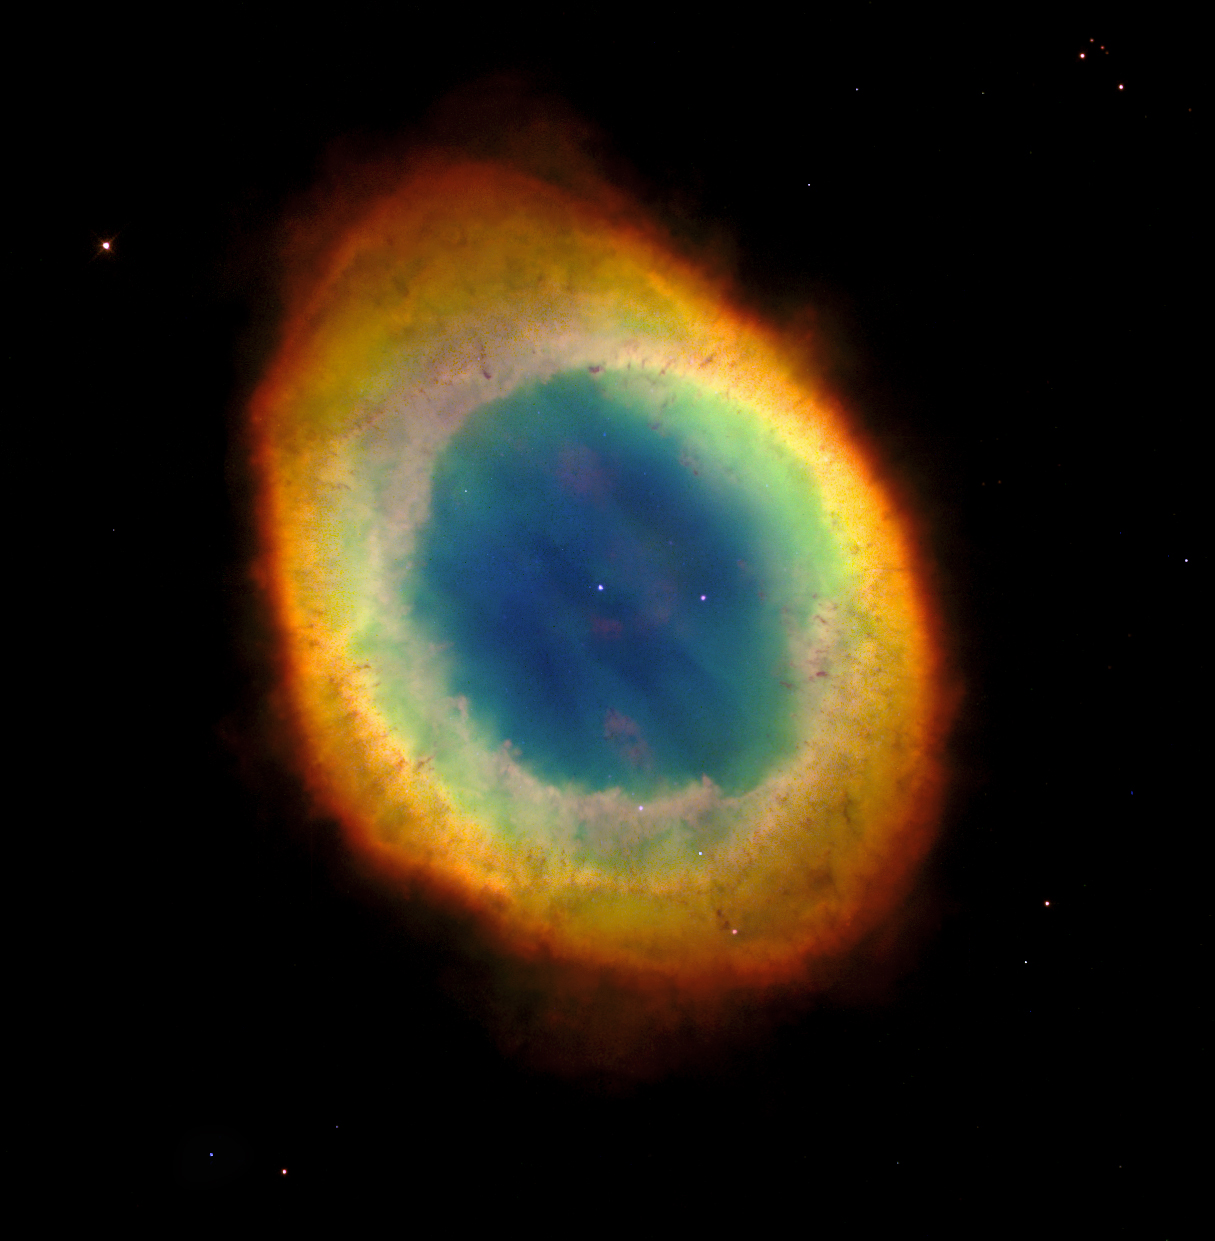
M57, a planetary nebula.